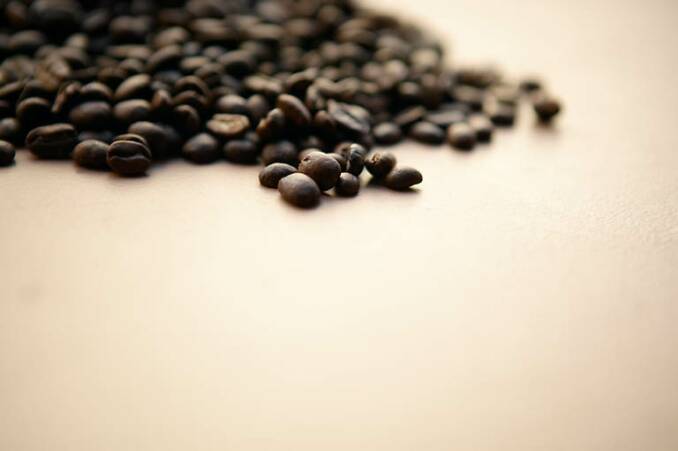
Coffee roasting is a complex process in regards to color analysis, because roasting at different temperatures, results in different end products, that
can, and do have the same color attributes.
Time, temperature, and color all have to be monitored simultaneously.
French Fries are another example where color analysis is actually shade analysis. Older technologies require extensive sample preparation, and the sample must be manually turned in front of the limited number of sensor spots, to help represent more of the sample.
The ColorTrack Benchtop, takes advantage of a microwave oven platform, as pictured below, to scan the moving sample. The entire path of the laser is scanned, at a rate of 10,000 signals per second. The average recommended scan takes 20 seconds, and the results are
provided in statistical format, including the average values, minimum and maximum values, mode, and standard deviation.
It's easy to see why, in color measurement, as well as in other disciplines, more data gives more representative results. Also, because it is the shade of color that represents how far along the process is, for many applications, trying to adapt to a human eye simulation model, presents it's own set of technological challenges,
that are of no direct benefit.
Using sophisticated software, the results of a 20 second scan (200,000 individual transmissions) are tabulated, and presented along with a grahical representation.

